The U.S. furniture import market saw a major shift in 2025, with the industry undergoing a key transformation. According to the latest data jointly released by the U.S. Bureau of Economic Analysis and the U.S. Census Bureau, the total value of U.S. furniture imports in 2025 reached $52.01 billion, down 8.2% from the previous year — import volumes continued to shrink. At the same time, the ranking of furniture suppliers to the U.S. changed significantly. Vietnam took the top spot with $14.48 billion in imports, Mexico remained in second place, and China fell to third. Southeast Asian countries became the main driver of market growth, as the U.S. furniture import supply chain is going through a deep restructuring.
In 2025, U.S. furniture imports from Vietnam reached $14.48 billion, up 2.9%.
The top 10 sources of U.S. furniture imports in 2025 are:
-
Vietnam: $14.48 billion, +2.9%
-
Mexico: $10.01 billion, -5.7%
-
China: $9.75 billion, -31.1%
-
Canada: $3.76 billion, -11.6%
-
Italy: $1.82 billion, -2.3%
-
Malaysia: $1.74 billion, +9.7%
-
Indonesia: $1.57 billion, +1.4%
-
Thailand: $1.10 billion, +29.3%
-
Cambodia: $0.89 billion, +35.9%
-
Taiwan (China): $0.87 billion, -18.8%
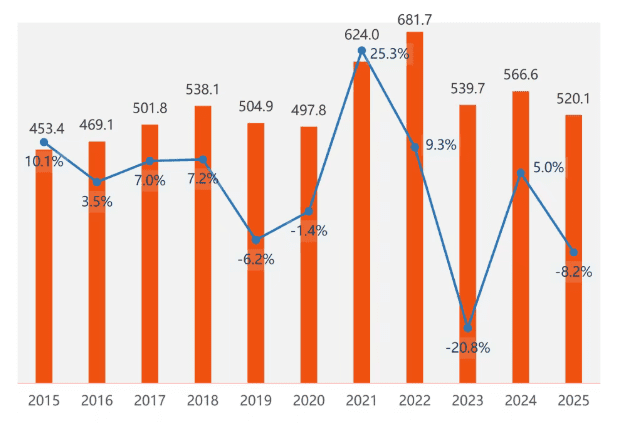
Historical U.S. Furniture Import Value
U.S. furniture imports fell across all nine major categories in 2025
PARTS OF SEATS,NESOI: $9.97 billion, -1.3%
SEATS WITH WOODEN FRAMES, UPHOLSTERED, NESOI: $7.38 billion, -10.1%
WOODEN FURNITURE, NESOI: $6.42 billion, -10.8%
METAL FURNITURE, NESOI: $5.33 billion, -23.6%
WOODEN FURNITURE (EXCEPT SEATS) OF A KIND USED INTHE BEDROOM: $3.78 billion, -5.0%
WOODEN FURNITURE (EXCEPT SEATS) OF A KIND USED INTHEKITCHEN: $2.74 billion, -3.6%
PARTS OF OTHER FURNITURE, NESOI: $2.26 billion, -2.7%
SEATS WITH METAL FRAMES, NOT UPHOLSTERED, NESOI: $2.00 billion, -13.2%
SEATS WITH METAL FRAMES, UPHOLSTERED, NESOI: $1.74 billion, -9.9%
WOODEN PARTS OF OTHER FURNITURE: $1.74 billion, +6.1%
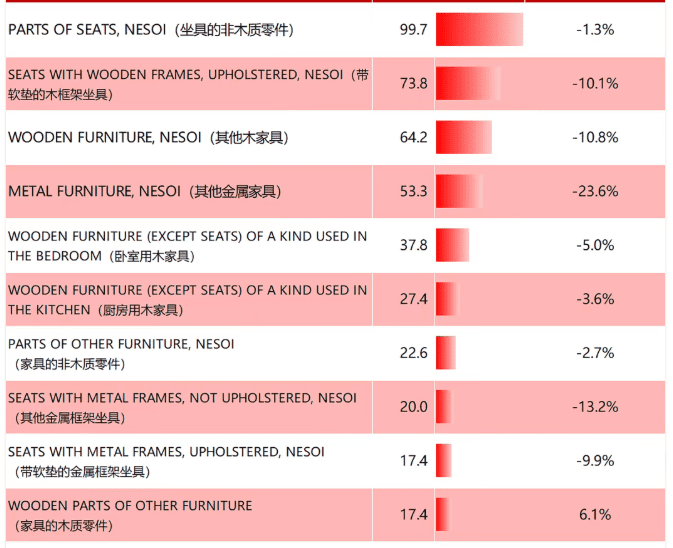
The Top 10 Furniture Import Categories in the U.S., 2025
Key supply countries have very different export product mixes to the U.S. market, each using their own strengths.
Vietnam’s top 5 furniture exports to the U.S. :
-
Wooden frame seats with cushions
-
Other wooden furniture
-
Wooden bedroom furniture
-
Wooden kitchen furniture
-
Other metal furniture
Mexico’s top 5 furniture exports to the U.S. :
-
Non-wood parts for seats
-
Wooden frame seats with cushions
-
Other metal furniture
-
Other wooden furniture
-
Non-wood parts for furniture
China’s top 5 furniture exports to the U.S. :
-
Other metal furniture
-
Wooden frame seats with cushions
-
Other metal frame seats
-
Other seats
-
Metal frame seats with cushions
Canada’s top 5 furniture exports to the U.S. :
-
Non-wood parts for seats
-
Metal office furniture
-
Wooden office furniture
-
Wooden kitchen furniture
-
Other metal furniture
Italy’s top 5 furniture exports to the U.S. :
-
Wooden frame seats with cushions
-
Other wooden furniture
-
Wooden bedroom furniture
-
Wooden parts for furniture
-
Wooden kitchen furniture”
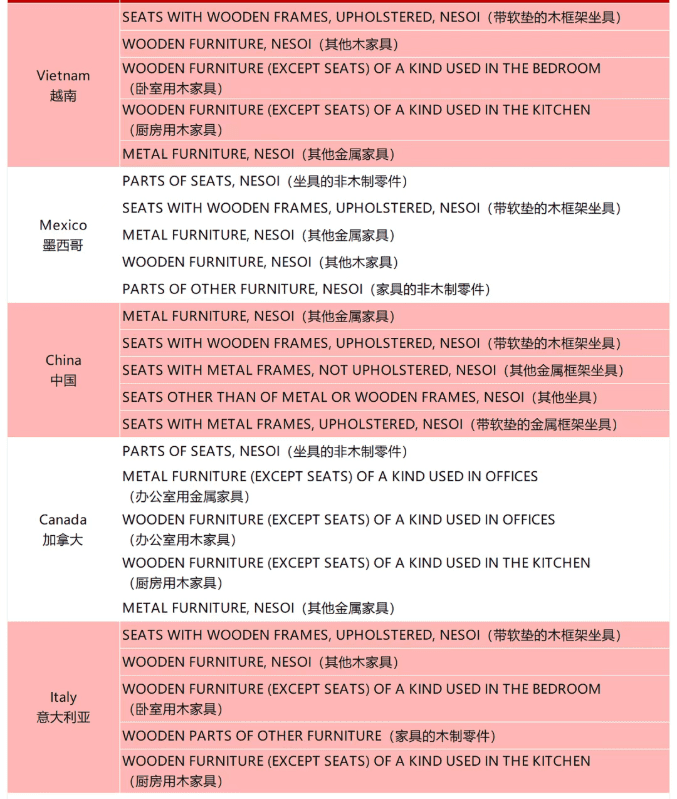
U.S. Furniture Imports: Top 5 Categories by Source Country, 2025
U.S. furniture imports fell 8.2% compared to the previous year. China dropped to third place in exports, while Vietnam took the lead and Southeast Asian countries became the main driver of growth. Among all import categories, nine out of ten saw declines — only wooden parts posted positive growth. These dual changes in product demand and supply patterns are driving a deep restructuring of the U.S. furniture import supply chain.